By Nicholas Freudenberg 

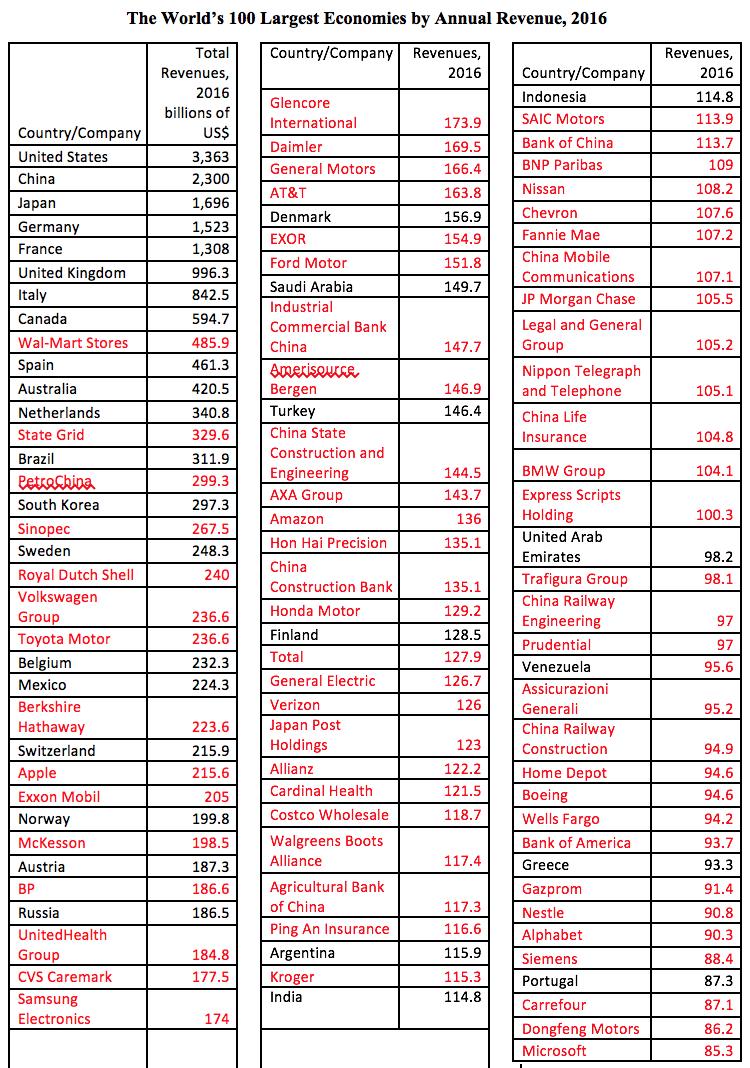
In 2014, 64 of the largest economies in the world were corporations and 36 were governments. Two years later, in 2016, 69 were corporations and 31 governments. The source for estimated revenues for governments was The CIA World Factbook and for corporations The Global Fortune 500 List, which reported 2016 annual revenues.
Between 2014 and 2016, total revenues for the 100 largest economies fell by 9%, from $29.9 trillion to $27.2 trillion. In that same period, the ratio of government to corporate revenues of the economies on the top 100 list fell from 1.9 in 2014 to 1.7 in 2016. In both years, governments on the list spent almost twice as much as corporations. This suggests that among the world’s largest economies, governments continue to play a crucial role in spending. What they do and don’t spend their revenues on has a crucial impact on health.
In 2016, the top 5 corporations accounted for about 16% of the revenues reported by businesses on the list. For governments, the five largest accounted for 59% of government spending, a mark of the continuing spending power of the governments of the world’s largest economies: United States, China, Japan, Germany and France. In 2016, the five largest governments outspent the five largest corporations by a ratio of almost six to one. Among the world’s largest economies, Big Government is still much bigger the Big Corporations.
Between 2014 and 2016, government revenues fell for a striking 26 of the 31(84%) governments that were on the list both times. For the 52 corporations on the list in both years, revenues fell for 32(62%), a lower percentage of revenue losers than among governments. Declines in oil prices contributed to falling revenues for both countries and corporations that lost revenue between 2014 and 2016.
Annual revenues are of course only one indicator of the size of a government or corporation but it is one metric that enables comparison of the two. Understanding the changing dynamics between governments and corporations is a critical priority for public health researchers seeking to take on the social determinants of health.
